89 properties — one capital-allocation pipeline
A portfolio of this scale cannot be managed through traditional scaffold-based inspections. It is operationally impossible: one inspection round would cost ~50M DKK and only gives a snapshot. Instead, the system produces the basis for allocating CAPEX across all 89 assets — in the same unit of measure, every year.
Headline numbers
89
Residential properties
150 buildings
~99M DKK
CAPEX freed up
vs. full replacement
~4,900
Roof damages registered
Individual damage lines
~30.4M DKK
M7 deferred capital
Reactive exposure
~85%
CO₂ vs. replacement
At portfolio level
The simple story — it's not a construction project, it's capital allocation
The asset manager has to choose: where do the CAPEX kroner make the biggest difference over the next 12 months — across all 89 assets, in the same unit of measure. The system already prioritized the portfolio — the manager only approves the allocation.
89 properties × 4 key figures × hundreds of data points per annual cycle, delivered in one consolidated report — not 89 separate engineering reports in different formats. The asset-management meeting spends ~90 minutes reviewing them.
The scaffolding equation
"Half of the 15-year CAPEX saving would go just to get permission to see the roof."
A full scaffold-inspection round of all 89 properties costs ~50M DKK — and gives a snapshot every 5–10 years. Drone monitoring costs ~0.6–1.0M DKK/year and gives continuous, uniform data on the whole portfolio. It's not a cost difference. It's a structural difference.
F1 vs F2 — CAPEX allocation
The system sets targeted maintenance (F1) against full replacement (F2) for the whole portfolio. The difference is the capital the asset manager can deploy freely — instead of tying it up in roofing.
~99M DKK
CAPEX allocation (76%) — capital not tied up in roofing, but available for energy measures, optionality and portfolio growth.
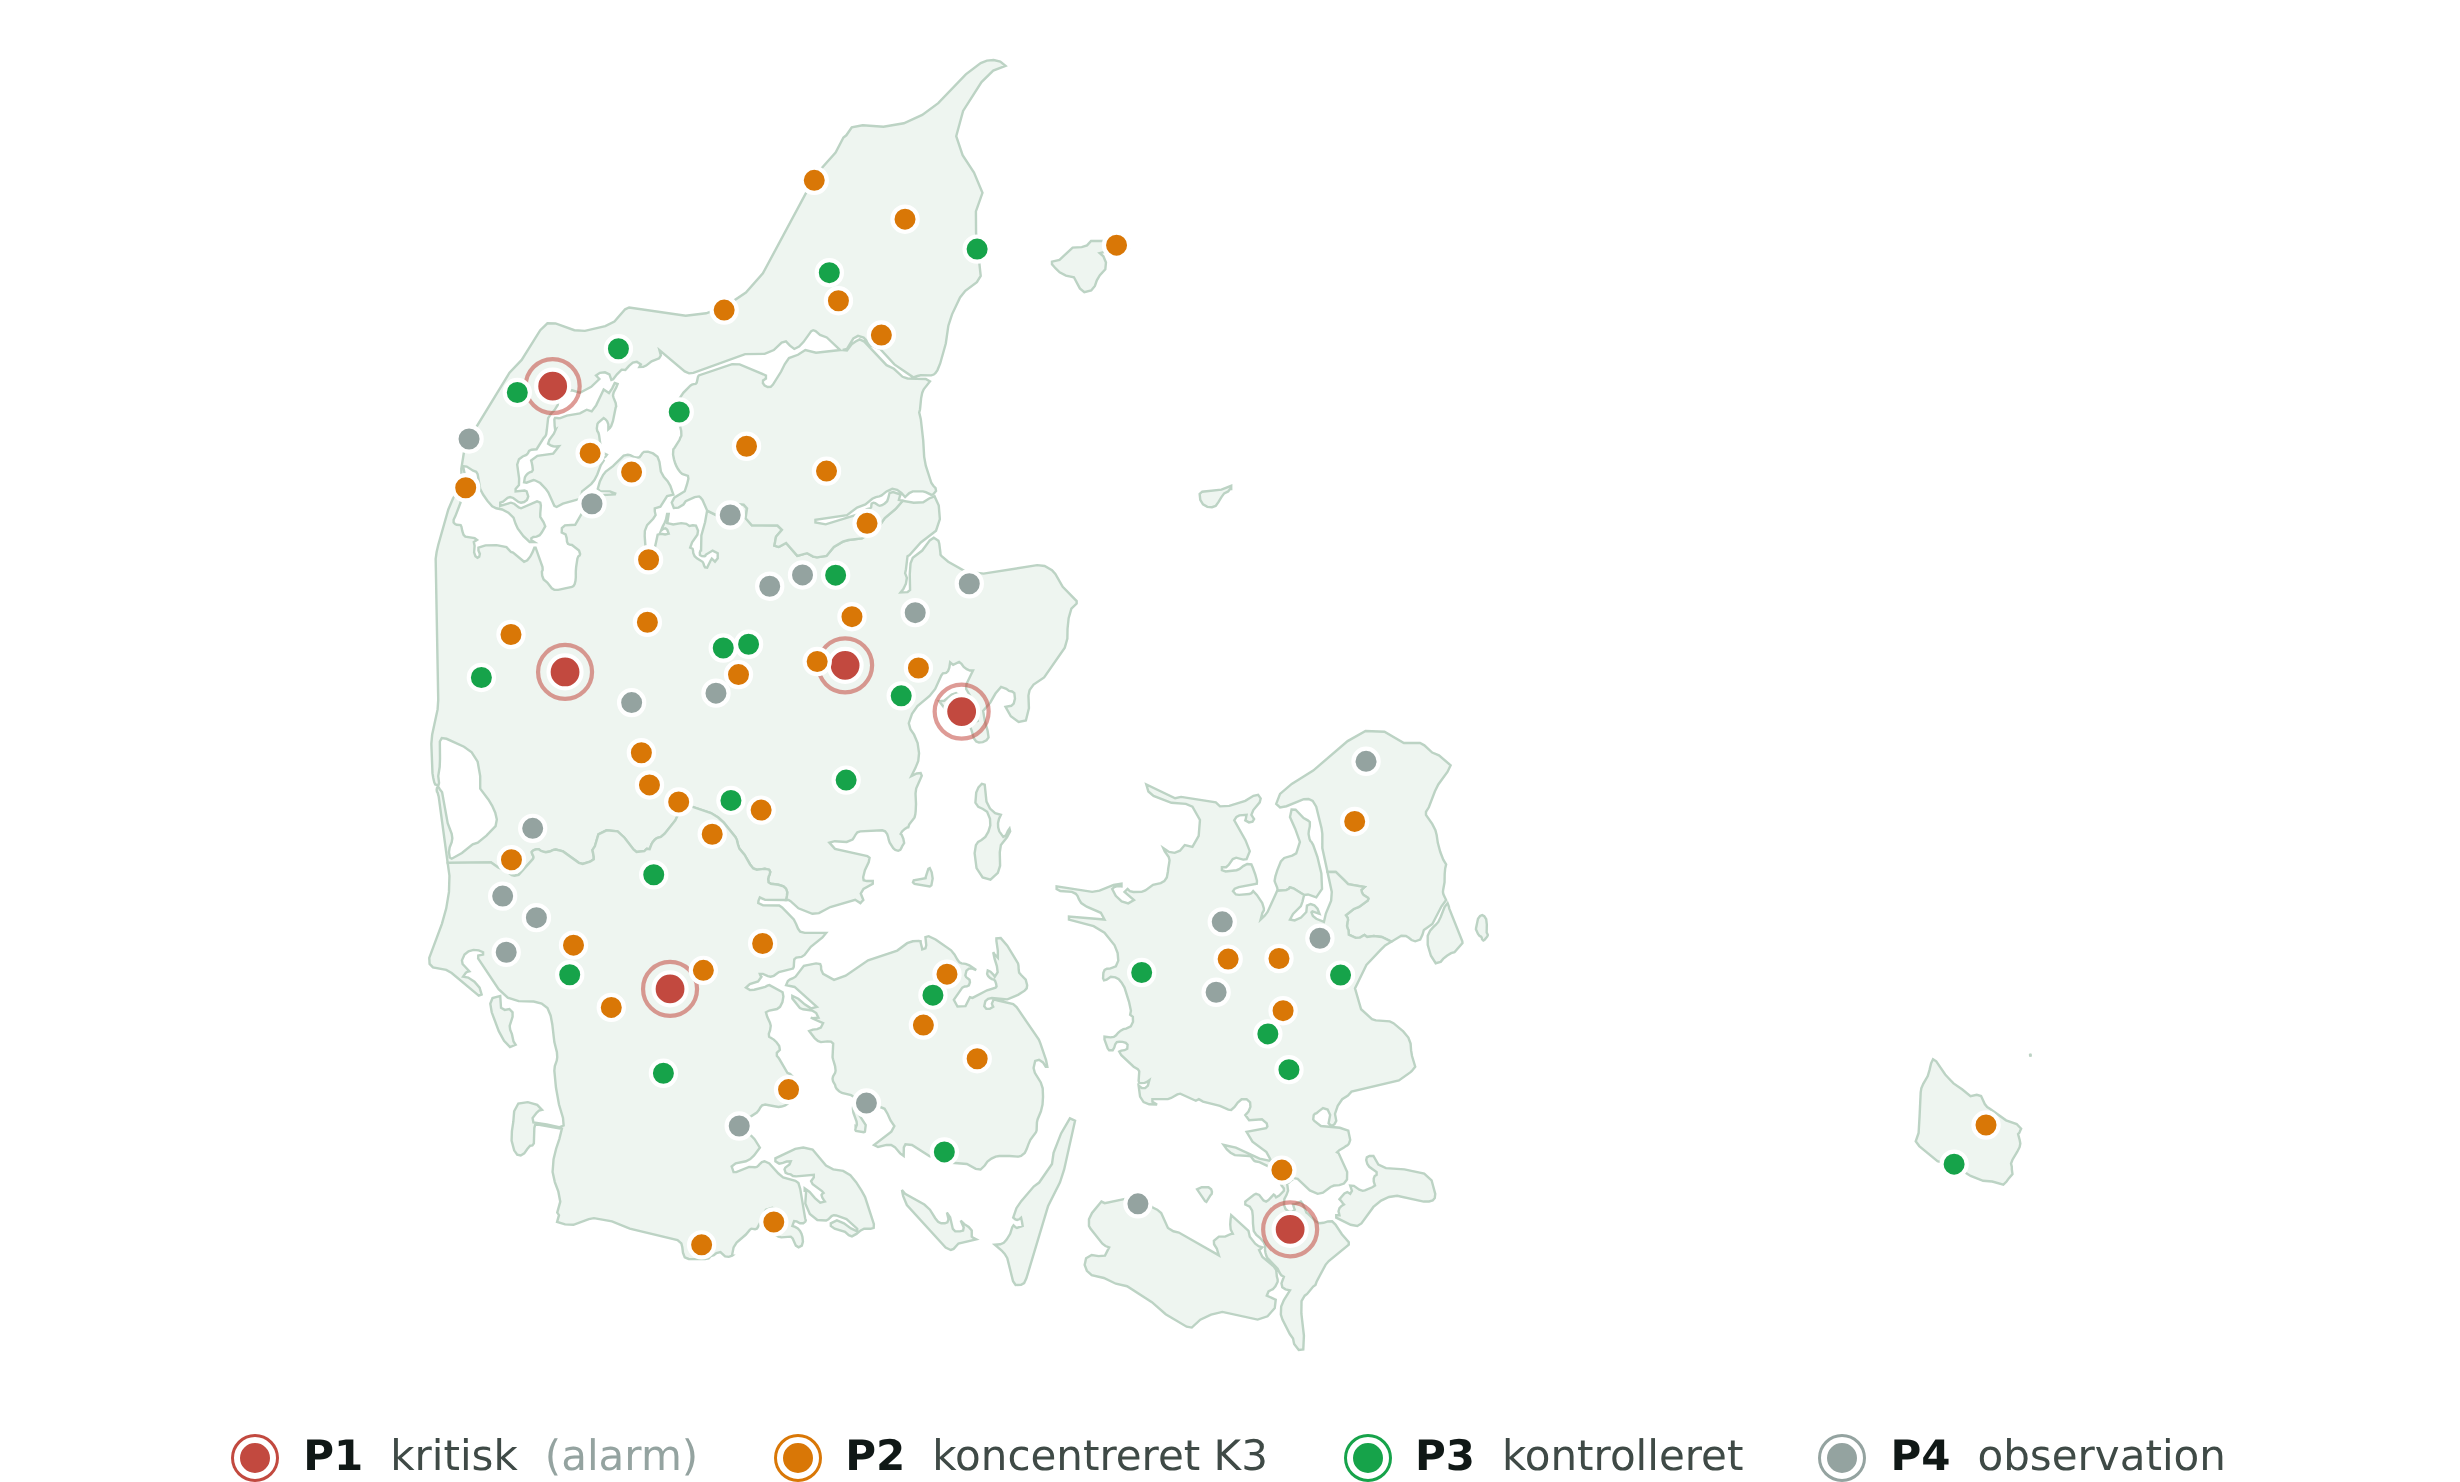
P1–P4 prioritization — the CAPEX kroner ranked
Capital-allocation matrix · 1 drone round (21 properties)
The system ranks each property by condition and K3 concentration.
| Tier | Share | Criterion | Year-1 budget | Total K3 | Properties |
|---|---|---|---|---|---|
| P1 — Critical | ~31% | Condition ≤ 43 (±25) | 7.6M DKK | 339 | 6 |
| P2 — Concentrated K3 | ~38% | K3 ≥ 50 regardless of condition | 8.4M DKK | 707 | 7 |
| P3 — Controlled | ~20% | K3 < 50 + condition 2 | 4.9M DKK | 162 | 4 |
| P4 — Observation | ~11% | Condition 1 + low K3 | 2.7M DKK | minimal | 4 |
AE · Molio dual price matrix — two comparable prices, per damage line
We produce both an internally calibrated AE price and Molio's official list price per damage. The ratio of 0.85 tells the asset manager that the portfolio is conservatively priced — if a tender comes in at 0.80–1.00 of the AE price, it's within expectations.
| Item | AE price | Molio price | Ratio |
|---|---|---|---|
| F1 portfolio maintenance (year 1) | ~31.2M | ~36.8M | 0.85 |
| F2 portfolio replacement | ~130.3M | ~153.3M | 0.85 |
| F1 total over 15 years | ~64–71M | ~76–84M | 0.85 |
| Capital preserved, 15 years | ~59–66M | ~70–78M | — |
No consulting engineer delivers that dual-price benchmark. It requires calibration across 2,000+ buildings plus access to the Molio pricebook and automated element to Molio-code mapping. The engine does it per damage line × 4,900 damages.
An 89-property portfolio cannot be managed through scaffold-based inspections. It is mathematically impossible — scaffold mobilization costs approximately DKK 50 million per inspection round and provides only a single snapshot in time.
The asset manager must decide where CAPEX funds should be allocated over the next 12 months across all 89 assets, using a consistent evaluation framework.
The Engine provides the basis for those decisions — 17 deliverables per portfolio review cycle, a dual-priority matrix integrated with AssetEye and Molio, P1–P4 prioritization, BR18 §298 compliance screening per property, and MEPS candidate identification.
The result is a CAPEX allocation strategy of DKK 99 million over a 15-year period.
This is not a construction project — it is capital allocation.
Tariq Kajjouj
Founder & CEO, DroneTjek ApS
Scale It Up
Want your portfolio on the same basis?
Let us quantify the whole portfolio. One drone-round gives one consolidated report with CAPEX prioritization on the same scale for all properties.
Request a Meeting